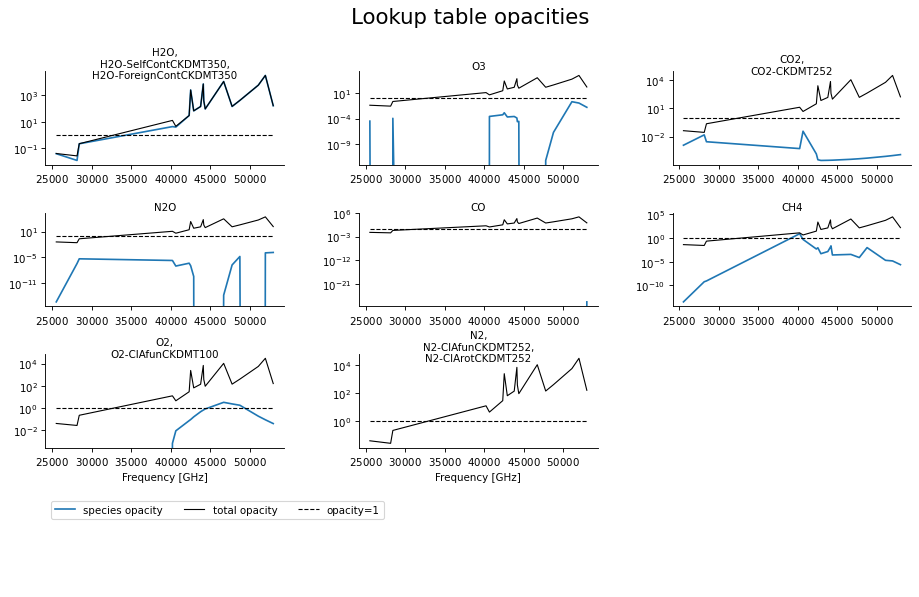
plot_arts_lookup
- pyarts.plots.arts_lookup.plot_arts_lookup(lookup, opacity=True, z=None, g=9.80665, r=287.0570048905812, tpert=0, vmrpert=0, pressures=None, cols=3, species=None)[source]
Visualize an ARTS lookup table.
Plots the opacity or the absorption cross sections based on an ARTS lookup table.
- Parameters:
lookup (pyarts.arts.GasAbsLookup) – ARTS lookup table object.
opacity (bool, optional) – Set to False to plot the absorption cross sections.
z (ndarray, optional) – Altitude profile. Optional input for opacity calculation. If not given, the layer thicknesses are calculated based on the hypsometric formula.
g (float, optional) – Gravity constant. Uses Earth’s gravity by default.
r (float, optional) – Gas constant for dry air. Uses constant for Earth by default.
tpert (int, optional) – Index of temperature perturbation to plot.
vmrpert (int, optional) – Index of vmr perturbation for nonlinear species to plot.
pressures (ndarray(int), optional) – Pressure levels to plot. If not given, up to 6 pressure levels are selected.
cols (int, optional) – Species to plot per row.
- Returns:
Matplotlib Figure and Axes objects.
- Return type:
matplotlib.figure.Figure, ndarray(AxesSubplot)
Examples:
from os.path import join, dirname
import matplotlib.pyplot as plt
import pyarts

lookup_file = join(dirname(pyarts.__file__), '../test/plots/reference',
                   'abs_lookup_small.xml')
fig, ax = pyarts.plots.plot_arts_lookup(pyarts.xml.load(lookup_file))

fig.suptitle('Lookup table opacities')
fig.subplots_adjust(top=0.88)
plt.show()
(
Source code,png,hires.png,pdf)
from os.path import join, dirname
import matplotlib.pyplot as plt
import pyarts
from pyarts.arts import ArrayOfArrayOfSpeciesTag, SpeciesTag

lookup_file = join(dirname(pyarts.__file__), '../test/plots/reference',
                   'abs_lookup_small.xml')
fig, ax = pyarts.plots.plot_arts_lookup(
    pyarts.xml.load(lookup_file),
    species=ArrayOfArrayOfSpeciesTag([[SpeciesTag("N2O")],
                                      [SpeciesTag("O3")]]),
    opacity=False)

fig.suptitle('Lookup table absorption cross sections [m$^2$]')
fig.subplots_adjust(top=0.88)
plt.show()
(
Source code,png,hires.png,pdf)