RRTMG interface#
import matplotlib.pyplot as plt
from typhon import plots

import konrad


plots.styles.use('typhon')


# Create an atmosphere component.
plev, phlev = konrad.utils.get_pressure_grids(1000e2, 1, 201)
atmosphere = konrad.atmosphere.Atmosphere(plev)

# It is possible to explicitly set different species (e.g. CO2).
atmosphere['CO2'][:] = 348e-6

# Create a surface component (T and p of the lowest atmosphere level are interpolated).
surface = konrad.surface.SlabOcean.from_atmosphere(atmosphere)

# Create cloud component (here clear-sky).
cloud = konrad.cloud.ClearSky.from_atmosphere(atmosphere)

# Create aerosol component (here clear-sky).
aerosol = konrad.aerosol.NoAerosol(atmosphere)

# Setup the RRTMG radiation component (choose zenith angle and solar constant).
rrtmg = konrad.radiation.RRTMG(zenith_angle=47.88)
rrtmg.calc_radiation(atmosphere, surface, cloud, aerosol)  # Actual RT simulation
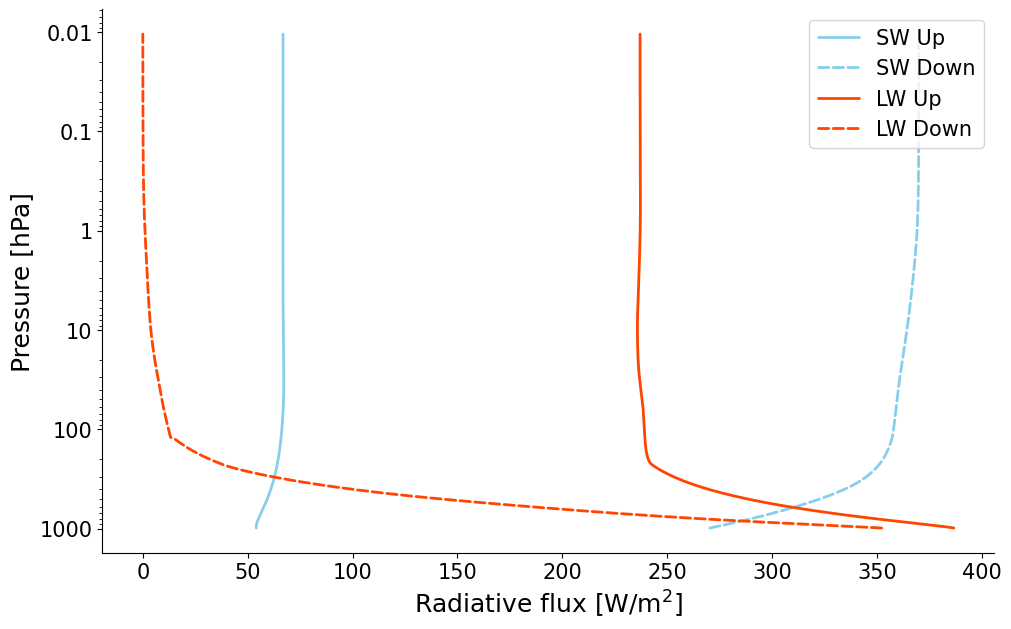
Plot radiative fluxes#
fig, ax = plt.subplots()
plots.profile_p_log(atmosphere['phlev'], rrtmg['sw_flxu'][-1, :],
                    label='SW Up', color='skyblue', ls='solid')
plots.profile_p_log(atmosphere['phlev'], rrtmg['sw_flxd'][-1, :],
                    label='SW Down', color='skyblue', ls='dashed')
plots.profile_p_log(atmosphere['phlev'], rrtmg['lw_flxu'][-1, :],
                       label='LW Up', color='orangered', ls='solid')
plots.profile_p_log(atmosphere['phlev'], rrtmg['lw_flxd'][-1, :],
                    label='LW Down', color='orangered', ls='dashed')
ax.legend(loc='upper right')
ax.set_xlabel('Radiative flux [$\sf W/m^2$]')
Text(0.5, 0, 'Radiative flux [$\\sf W/m^2$]')
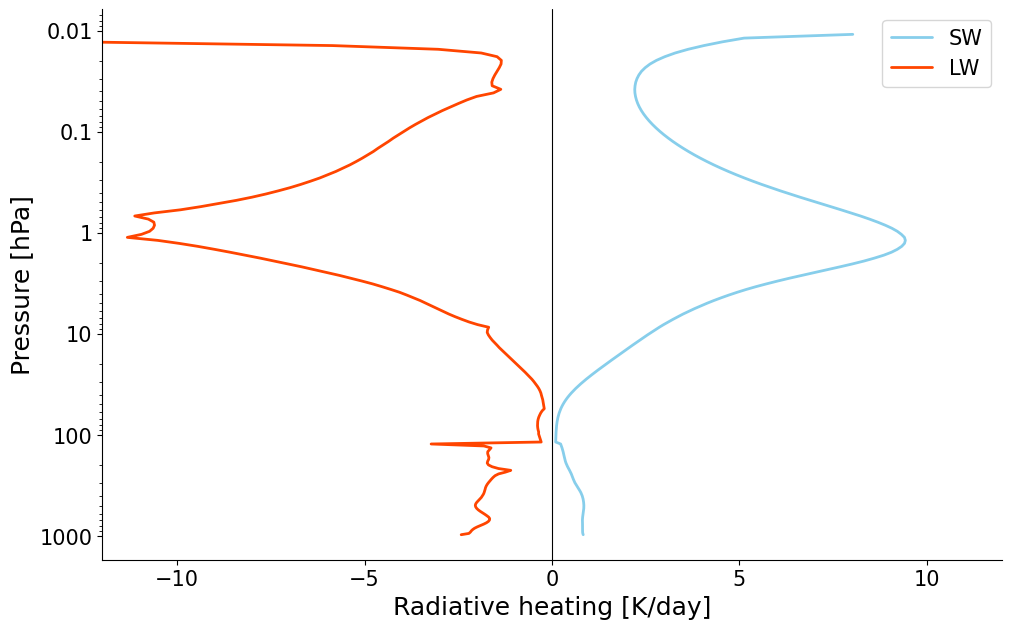
Plot radiative heating#
# Plot the calculated fluxes.
fig, ax = plt.subplots()
ax.axvline(0, color='black', linewidth=0.8)
plots.profile_p_log(atmosphere['plev'], rrtmg['sw_htngrt'][-1, :],
                    label='SW', color='skyblue')
plots.profile_p_log(atmosphere['plev'], rrtmg['lw_htngrt'][-1, :],
                    label='LW', color='orangered')
ax.legend(loc='upper right')
ax.set_xlabel('Radiative heating [K/day]')
ax.set_xlim(-12, 12)
(-12.0, 12.0)